Lab 1.2: Discovery
VMs Needed
- Windows
- Ubuntu
Lab Video
Objectives
- Demonstrate common use cases for the Nmap scanner.
- Explore Nmap scanning techniques for local and remote subnets.
- Illustrate the use of Nmap scripts for service version detection and setting enumeration.
- Examine how to use Nessus to perform a network discovery scan.
Lab Preparation
Ensure the VMs needed for the lab are booted and that you have logged in to the Windows VM.
Launch a PowerShell Core terminal on the Windows VM by clicking the Windows Terminal icon in the taskbar.

Open an SSH connection to the Ubuntu VM in Windows Terminal. Click the down arrow icon and select SSH-Ubuntu from the drop-down menu.
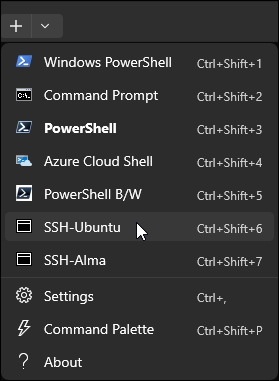
The following commands should be run in the SSH-Ubuntu terminal you just opened.
Obtain a root shell on the Ubuntu system using this command:
sudo su -
Sample Results
student@ubuntu:~$ sudo su -
root@ubuntu:~#
Note that the prompt on the ubuntu server has changed from a '$' character to a '#' character to indicate that you have successfully created a root shell.
Part 1: Host Discovery Techniques
Environment Check
Before proceeding, ensure that you are working in Windows Terminal in a root SSH session to the Ubuntu VM.

Background: In this lab, you will use Nmap to perform host discovery, port scanning, and service version identification.
Instructions: From your Ubuntu VM root session, run an nmap command to perform a host discovery on the local subnet. To avoid getting results from your physical laptop's VMware products, you will restrict the scan range to IPs used for virtual machines.
Remember that for a local scan, Nmap will use ARP to perform the discovery of hosts. If your pod is setup correctly, Nmap should discover 13 hosts on the network.
nmap -sn -n 10.50.7.20-110
Sample Results
root@ubuntu:~# nmap -sn -n 10.50.7.20-110
Starting Nmap 7.95 ( https://nmap.org ) at 2024-03-12 23:43 UTC
Nmap scan report for 10.50.7.20
Host is up.
Nmap scan report for 10.50.7.21
Host is up.
...
[Results Truncated]

Nmap done: 91 IP addresses (13 hosts up) scanned in 3.53 seconds
If you were attempting to scan a remote subnet, ARP scanning would not be available, since ARP relies on MAC broadcasts that will not pass a router. You can simulate remote scanning by disabling the "ARP ping" feature of Nmap. Re-scan the network without ARP and note the difference in results. Also, note that the scan may be slower, as Nmap waits to see if echo replies are returned from each host.
nmap -sn -n --disable-arp-ping 10.50.7.20-110
Sample Results
root@ubuntu:~# nmap -sn -n --disable-arp-ping 10.50.7.20-110
Starting Nmap 7.95 ( https://nmap.org ) at 2024-03-13 00:01 UTC
Nmap scan report for 10.50.7.20
Host is up.
Nmap scan report for 10.50.7.21
Host is up.
...
[Results Truncated]

Nmap done: 91 IP addresses (12 hosts up) scanned in 66.16 seconds
In this scan, the Windows VM at 10.50.7.101 did not respond. The firewall on the VM does not allow ICMP echo responses, so you would miss this host if you were scanning remotely!
To detect remote hosts that do not respond to ICMP, you can fine-tune the Nmap scan by using TCP SYN packets for ports that are more likely to be open on the host.
nmap -n -sn --disable-arp-ping -PE -PS22,80,443,135,445 10.50.7.20-110
Sample Results
root@ubuntu:~# nmap -n -sn --disable-arp-ping -PE -PS22,80,443,135,445 10.50.7.20-110
Starting Nmap 7.95 ( https://nmap.org ) at 2024-03-13 00:03 UTC
Nmap scan report for 10.50.7.20
Host is up.
Nmap scan report for 10.50.7.21
Host is up.
...
[Results Truncated]

Nmap done: 91 IP addresses (13 hosts up) scanned in 38.50 seconds
This command uses a combination of ICMP echo requests (-PE) and TCP SYN packets to the ports listed, which can find many Linux and Windows hosts and web servers. It was able to detect the Windows VM because the Windows host responded to at least one of the SYN packets. On your audits, you may have to fine-tune your host discovery techniques to avoid false-negative scan results.
Part 2: SYN Stealth vs. SYN Connect Scanning
Environment Check
Before proceeding, ensure that you are working in Windows Terminal in a root SSH session to the Ubuntu VM.
Background: Nmap's default TCP scanning technique is known as SYN stealth scanning. In this mode, Nmap completes part of the TCP three-way handshake with the host and then aborts the connection using a TCP RST (reset) packet. Because Nmap is designed as more of a hacking tool than an audit tool, this makes sense because many hosts don't log the incoming connection until the handshake has been completed. For your audit purposes, you will likely want to use TCP full connect scanning, which completes the three-way handshake and performs a normal teardown of the connection using the TCP FIN (finish) flag. Full connect scanning requires a bit more overhead but will often yield more accurate results with fewer unwanted side effects on the host being scanned. In this section of the lab, you will compare the results obtained with a SYN stealth scan to those returned by a TCP full connect scan.
Instructions: From your Ubuntu SSH session, run a stealth scan of a portion of the local subnet. In this example, you will specify the stealth scan type with the "-sS" flag, but this is not strictly necessary since stealth scanning is the default.
nmap -sS -p 1-65535 10.50.7.20-29
Sample Results
root@ubuntu:~# nmap -sS -p 1-65535 10.50.7.20-29
Starting Nmap 7.95 ( https://nmap.org ) at 2024-03-13 00:06 UTC
Nmap scan report for ubuntu (10.50.7.20)
Host is up (0.000011s latency).
Not shown: 65515 closed tcp ports (reset)
PORT      STATE    SERVICE
22/tcp    open     ssh
25/tcp    open     smtp
80/tcp    open     http
443/tcp   open     https
...
[Results Truncated]

Nmap scan report for ubuntu (10.50.7.26)
Host is up (0.0000070s latency).
Not shown: 65516 closed tcp ports (reset)
PORT      STATE    SERVICE
22/tcp    open     ssh
25/tcp    open     smtp
80/tcp    filtered http
507/tcp   open     crs
2003/tcp  open     finger
...
[Results Truncated]
Notice that the Nginx server at port 80 on the host at 10.50.7.26 is reported as "filtered" rather than open or closed. NMAP uses this port status when it receives indeterminate or no results from the target. Next, run the same scan using the TCP full connect option:
nmap -sT -p 1-65535 10.50.7.20-29
Sample Results
root@ubuntu:~# nmap -sT -p 1-65535 10.50.7.20-29
Starting Nmap 7.95 ( https://nmap.org ) at 2024-03-13 00:08 UTC
Nmap scan report for ubuntu (10.50.7.20)
Host is up (0.000097s latency).
Not shown: 65515 closed tcp ports (conn-refused)
PORT      STATE SERVICE
22/tcp    open  ssh
25/tcp    open  smtp
80/tcp    open  http
443/tcp   open  https
...
[Results Truncated]

Nmap scan report for ubuntu (10.50.7.26)
Host is up (0.00036s latency).
Not shown: 65516 closed tcp ports (conn-refused)
PORT      STATE SERVICE
22/tcp    open  ssh
25/tcp    open  smtp
80/tcp    open  http
507/tcp   open  crs
2003/tcp  open  finger
...
[Results Truncated]
This time, the server responds with a SYN/ACK segment, and the port is reported as open. We find full connect scanning to be much more reliable for audit purposes.
Part 3: Version Fingerprinting with Nmap
Environment Check
Before proceeding, ensure that you are working in Windows Terminal in a root SSH session to the Ubuntu VM.
Background: Nmap can fingerprint service versions found on hosts. The service version scanning feature uses a combination of banner grabbing and active probes to try to determine the version of the service which is running. In this section of the lab, you will use this feature to fingerprint the SSH and web server versions running on the hosts in a block of IP addresses.
Instructions: Use the version scanning feature of Nmap to enumerate the SSH and web server versions running on the Ubuntu VM and its kubernetes-hosted containers. From your SSH connection to the Ubuntu VM, run this command:
nmap -sT -p22,80 -sV 10.50.7.20-25
Sample Results
root@ubuntu:~# nmap -sT -p22,80 -sV 10.50.7.20-25
Starting Nmap 7.95 ( https://nmap.org ) at 2024-03-13 00:11 UTC
Nmap scan report for ubuntu (10.50.7.20)
Host is up (0.00015s latency).

PORT   STATE SERVICE VERSION
22/tcp open  ssh     OpenSSH 9.6p1 Ubuntu 3ubuntu13.9 (Ubuntu Linux; protocol 2.0)
80/tcp open  http    nginx 1.24.0 (Ubuntu)
Service Info: OS: Linux; CPE: cpe:/o:linux:linux_kernel

Nmap scan report for ubuntu (10.50.7.21)
Host is up (0.00036s latency).

PORT   STATE  SERVICE VERSION
22/tcp open   ssh     OpenSSH 9.6p1 Ubuntu 3ubuntu13.9 (Ubuntu Linux; protocol 2.0)
80/tcp closed http
Service Info: OS: Linux; CPE: cpe:/o:linux:linux_kernel

Nmap scan report for ubuntu (10.50.7.22)
Host is up (0.00030s latency).
...
[Results Truncated]
Notice first that the SSH version is the same for all IP addresses. This is to be expected, since all these IPs are hosted on the Ubuntu VM. As part of your audit, you should check the OpenSSH server version to be sure it meets organizational standards and that it contains no known vulnerabilities.
You may also notice that the webservers which respond are all running the same version of Nginx, as well. This is because the organization is using Nginx as a load-balancer in front of a Kubernetes cluster hosting the web applications. If you really want to see what webservers are running in the application containers, you will need to scan the Kubernetes environment. In our lab, the Kubernetes application services are exposed on the loopback IP address (in the real world, these would likely be on some private internal IP address).
You can view the ports being used to host the web applications using the kubectl command:
microk8s kubectl get services
Sample Results
root@ubuntu:~# microk8s kubectl get services
NAME         TYPE        CLUSTER-IP      EXTERNAL-IP   PORT(S)          AGE
kubernetes   ClusterIP   10.152.183.##   <none>        443/TCP          11d
juice-shop   NodePort    10.152.183.##   <none>        8000:30020/TCP   9d
dvwa         NodePort    10.152.183.##   <none>        8000:30024/TCP   9d
bwapp        NodePort    10.152.183.##   <none>        8000:30022/TCP   9d
wackopicko   NodePort    10.152.183.##   <none>        8000:30023/TCP   9d
The ports in the 30020-30024 range are the ones you'll be interested in. Scan the container-hosted web applications using this command, and make note of the web server software versions returned.
nmap -sT -p30020-30024 -sV 127.0.0.1
Sample Results
PORT      STATE  SERVICE VERSION
30020/tcp open   unknown
30021/tcp closed unknown
30022/tcp open   http    Apache httpd 2.4.7 ((Ubuntu))
30023/tcp open   http    Apache httpd 2.4.7 ((Ubuntu))
30024/tcp open   http    Apache httpd 2.4.25 ((Debian))
1 service unrecognized despite returning data. If you know the service/version, please submit the following fingerprint at https://nmap.org/cgi-bin/submit.cgi?new-service :
SF-Port30020-TCP:V=7.95%I=7%D=3/13%Time=65F0EFF6%P=x86_64-redhat-linux-gnu
...
[Results Truncated]
The web application running on port 30020 is using a Node.js web server, which is not recognized by Nmap. At the bottom of the Nmap output, you will see a fingerprint of the server, which could be sent to the Nmap developers to improve their detection database.
For this audit, we are interested in the three different applications using Apache as the web server, with two very different Apache version numbers. Take some time to research the Apache versions and see if they might be vulnerable. When considering your recommendations to the organization being audited, remember that configuration and change management for container-based applications may be handled differently than for traditional infrastructure.
Potential Audit Finding
The old versions of Apache running on containers in the Kubernetes cluster should be noted in the audit report. The report paragraph might look like this:
"We found that there are three containers hosted in the Kubernetes cluster which are running outdated versions of the Apache web server software. This could allow attackers to exploit known vulnerabilities in these containers. We recommend patching the containers and instituting a system of regularly reviewing container-hosted software for vulnerabilities."
Part 4: Nmap Output Files and Continuous Monitoring
Environment Check
Before proceeding, ensure that you are working in Windows Terminal in a root SSH session to the Ubuntu VM.
Background: Remember from the class discussion that Nmap can save its output to disk files in various formats. In this section of the lab, you will explore this feature and then use a saved XML scan result as the baseline for a continuous network monitoring effort.
Instructions: Begin by performing a scan of a single host on the lab network, saving the results to an Nmap text file. From your SSH connection to the Ubuntu VM, run this command:
nmap -sT -p 1-65535 10.50.7.20 -oN scan.txt
Sample Results
root@ubuntu:~# nmap -sT -p 1-65535 10.50.7.20 -oN scan.txt
Starting Nmap 7.95 ( https://nmap.org ) at 2024-03-13 00:15 UTC
Nmap scan report for ubuntu (10.50.7.20)
Host is up (0.00010s latency).
Not shown: 65515 closed tcp ports (conn-refused)
PORT      STATE SERVICE
22/tcp    open  ssh
25/tcp    open  smtp
80/tcp    open  http
...
[Results Truncated]
After the scan completes, examine the content of the results file using the cat command:
cat scan.txt
Sample Results
root@ubuntu:~# cat scan.txt
# Nmap 7.95 scan initiated Wed Mar 13 00:15:31 2024 as: nmap -sT -p 1-65535 -oN scan.txt 10.50.7.20
Nmap scan report for ubuntu (10.50.7.20)
Host is up (0.00010s latency).
Not shown: 65515 closed tcp ports (conn-refused)
PORT      STATE SERVICE
22/tcp    open  ssh
25/tcp    open  smtp
80/tcp    open  http
...
[Results Truncated]
Notice that the text file contains the results printed to the screen, but with an added header and footer. The header includes the Nmap command that was used to generate the results. This is a useful feature because you can provide this text file to another auditor or administrator, and they could replicate your test by using the same command that you ran.
Next, use this command to run a scan of multiple hosts, saving the results in an XML file:
nmap -sT -p 1-65535 10.50.7.20-29 -oX baseline.xml
Sample Results
root@ubuntu:~# nmap -sT -p 1-65535 10.50.7.20-29 -oX baseline.xml
Starting Nmap 7.95 ( https://nmap.org ) at 2024-03-13 00:16 UTC
Nmap scan report for ubuntu (10.50.7.20)
Host is up (0.000095s latency).
Not shown: 65515 closed tcp ports (conn-refused)
PORT      STATE SERVICE
22/tcp    open  ssh
25/tcp    open  smtp
80/tcp    open  http
...
[Results Truncated]
Examine the format of the XML file produced by Nmap using the cat command:
cat baseline.xml
Sample Results
root@ubuntu:~# cat baseline.xml
<?xml version="1.0" encoding="UTF-8"?>
<!DOCTYPE nmaprun>
<?xml-stylesheet href="file:///usr/bin/../share/nmap/nmap.xsl" type="text/xsl"?>
<!-- Nmap 7.95 scan initiated Wed Mar 13 00:16:36 2024 as: nmap -sT -p 1-65535 -oX baseline.xml 10.50.7.20-29 -->
<nmaprun scanner="nmap" args="nmap -sT -p 1-65535 -oX baseline.xml 10.50.7.20-29" start="1710288996" startstr="Wed Mar 13 00:16:36 2024" version="7.95" xmloutputversion="1.05">
<scaninfo type="connect" protocol="tcp" numservices="65535" services="1-65535"/>
<verbose level="0"/>
<debugging level="0"/>
<host starttime="1710288996" endtime="1710289000"><status state="up" reason="localhost-response" reason_ttl="0"/>
<address addr="10.50.7.20" addrtype="ipv4"/>
<hostnames>
<hostname name="ubuntu" type="PTR"/>
</hostnames>
...
[Results Truncated]
You will use the baseline.xml file you just created as the baseline file in a simulation of continuous monitoring. To demonstrate how to find host and port changes with Nmap, you will need to create a difference in the host's running configuration. To ensure that you will have interesting results from your second scan, run this command to stop the Nginx service on the Ubuntu VM:
systemctl stop nginx.service
Now that you've changed the state of the network, run a new scan, saving the results to a second XML file.
nmap -sT -p 1-65535 10.50.7.20-29 -oX observed.xml
Sample Results
root@ubuntu:~# systemctl stop nginx.service
root@ubuntu:~# nmap -sT -p 1-65535 10.50.7.20-29 -oX observed.xml
Starting Nmap 7.95 ( https://nmap.org ) at 2024-03-13 00:17 UTC
Nmap scan report for ubuntu (10.50.7.20)
Host is up (0.00010s latency).
Not shown: 65518 closed tcp ports (conn-refused)
PORT      STATE SERVICE
22/tcp    open  ssh
25/tcp    open  smtp
2003/tcp  open  finger
2004/tcp  open  mailbox
3000/tcp  open  ppp
...
[Results Truncated]
Next, use the "yandiff" tool to create a text-based report on the screen, detailing the differences between the two scans:
yandiff --baseline baseline.xml --observed observed.xml
Sample Results
root@ubuntu:~# yandiff --baseline baseline.xml --observed observed.xml
yandiff run Wed Mar 13 00:18:15 2025
command line: --baseline baseline.xml --observed observed.xml
baseline: baseline.xml
observed: observed.xml
node key: IP
New hosts:

Missing hosts:

Changed hosts:
        10.50.7.20 (ubuntu) - up
                New Services:
                Missing Services:
                        80/tcp/open (http)
                        443/tcp/open (https)
                        507/tcp/open (crs)
                Changed Services:
        10.50.7.21 (ubuntu) - up
                New Services:
                Missing Services:
...
[Results Truncated]
This output could be forwarded to a system or security administrator via email to notify them that a change has occurred in the environment.
Yandiff can also export the results as XML for easier ingestion into a SIEM or other security tool. Use these commands to create and view an XML file containing the differences found between your baseline and observed scans. Note that the XML file contains a structured view of the differences you already saw reported above.
yandiff --baseline baseline.xml --observed observed.xml --format xml --output-file nmapDiff.xml
cat nmapDiff.xml
Sample Results
root@ubuntu:~# yandiff --baseline baseline.xml --observed observed.xml --format xml --output-file nmapDiff.xml
cat nmapDiff.xml
<?xml version="1.0" encoding="utf-8"?>
<yandiff rundate="Wed Mar 13 00:18:40 2024" version="1.3" command_line="--baseline baseline.xml --observed observed.xml --format xml --output-file nmapDiff.xml">
<parameters node_key="IP">
<baseline>
<file>baseline.xml</file>
<scan_args>nmap -sT -p 1-65535 -oX baseline.xml 10.50.7.20-29</scan_args>
<nmap_version>7.95</nmap_version>
<scan_start>Wed Mar 13 00:16:36 2024</scan_start>
</baseline>
<observed>
...
[Results Truncated]
Finally, restore the server to its original state by restarting the Nginx service:
systemctl start nginx.service
When you have finished exploring, you can exit the root shell session and close the Windows Terminal Ubuntu SSH session.
exit
Sample Results
root@ubuntu:~# systemctl start nginx.service
root@ubuntu:~# exit
logout
student@ubuntu:~$
Part 5: Nessus Discovery Scan
Background Nessus can also be used for performing a discovery scan of a network environment. In this section of the lab, you will use Nessus to perform a discovery scan of your lab environment.
Instructions: On your Windows VM, open the Firefox web browser by double-clicking its icon on the desktop.

Click on the Nessus bookmark in the Firefox bookmarks bar or browse to https://scanner.lab.local:8834/#/.
https://scanner.lab.local:8834/#/

When the Nessus web page loads, log in by entering the credentials you created during the setup lab and clicking the Sign In button:
Username:
student
Password:
student
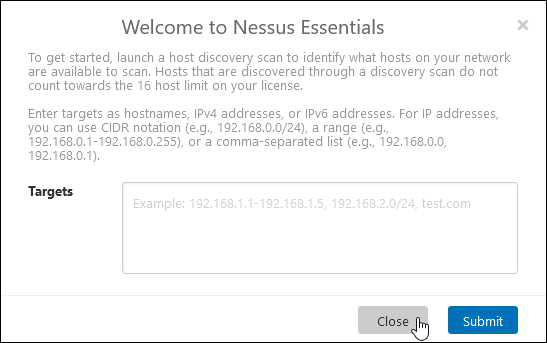
Nessus will offer to run a discovery scan of the network, but we will configure our own scan later in the lab. Click the Close button to dismiss the "Welcome to Nessus Essentials" box.
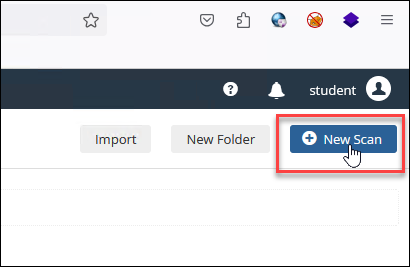
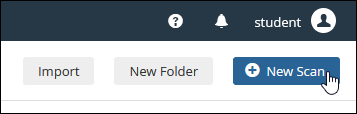
Begin a new discovery scan by clicking the New Scan button in the top right of the Nessus browser window. You may need to close any pop-up messages from Nessus that are covering the New Scan button.
If messages advertising commercial versions of Nessus appear at any time during your labs, you can dismiss them, also.

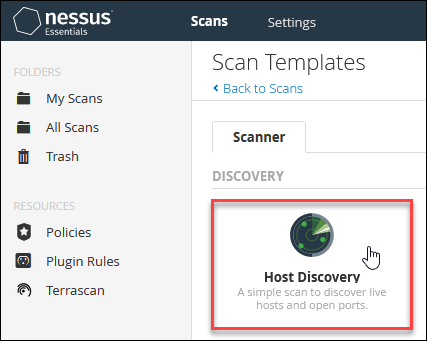
Click the Host Discovery scan template in the resulting browser window.
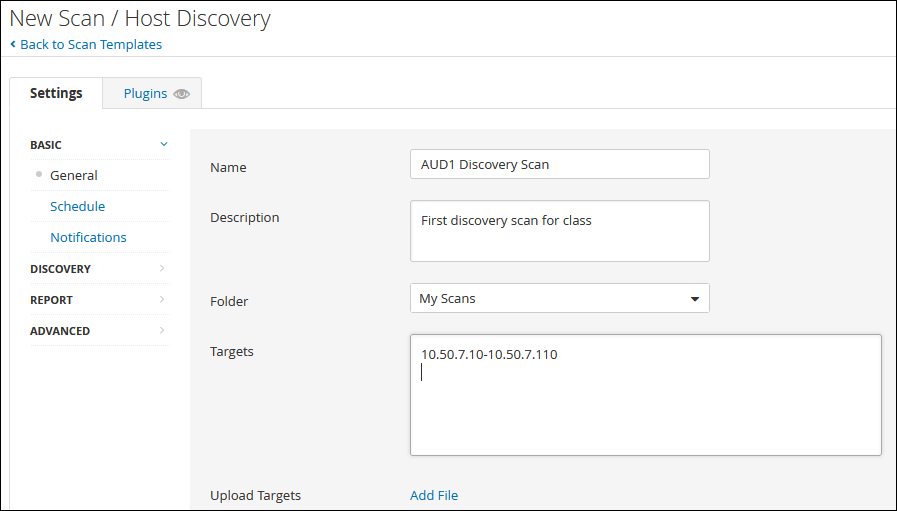
Fill in the textboxes in the Settings tab with this information:
Name:
AUD1 Discovery Scan
Description:
First discovery scan for class
Targets:
10.50.7.10-10.50.7.110
When you're finished, your screen should look like this:
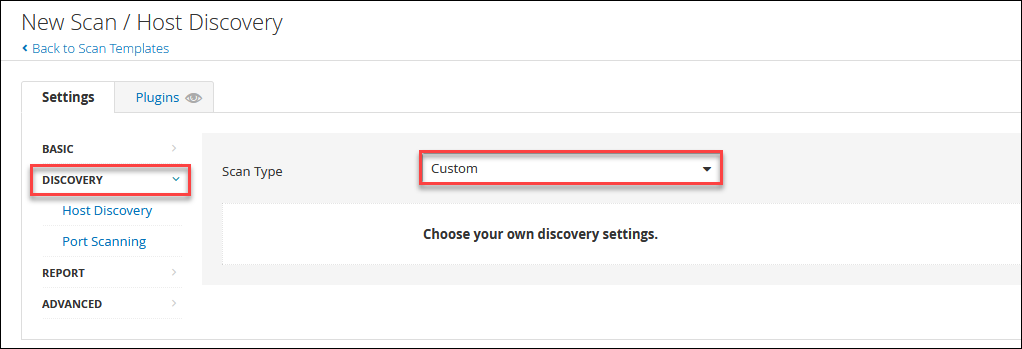
Click on the DISCOVERY link to the left of the page. Select Custom from the Scan Type drop-down list.
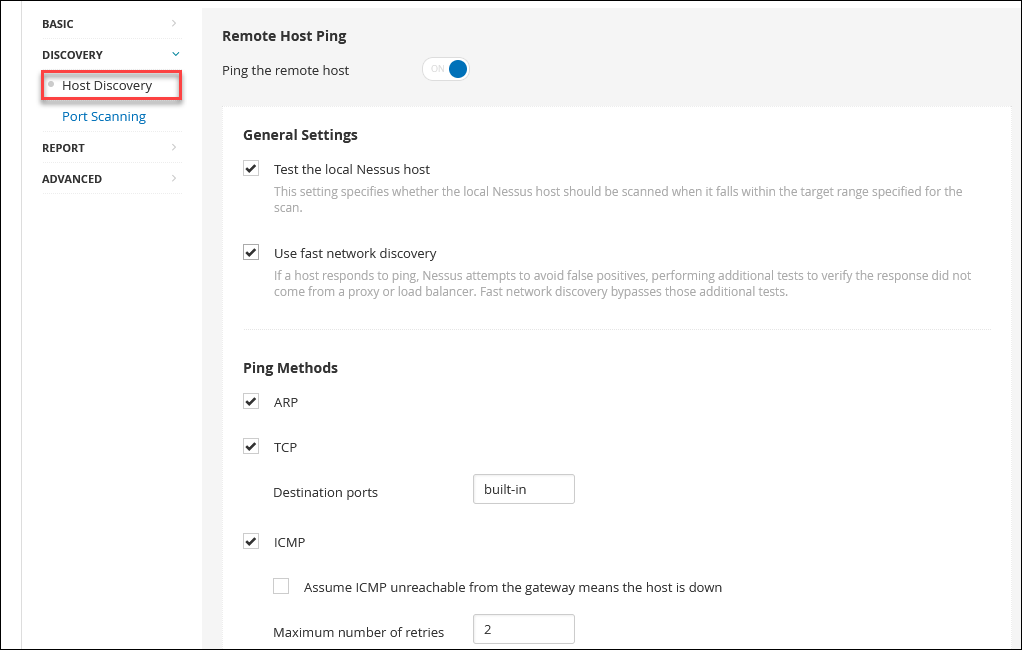
Click the Host Discovery link and ensure that your settings match those in the screenshot below.
Click the Port Scanning link and make your selections to match the settings in the screenshot below.
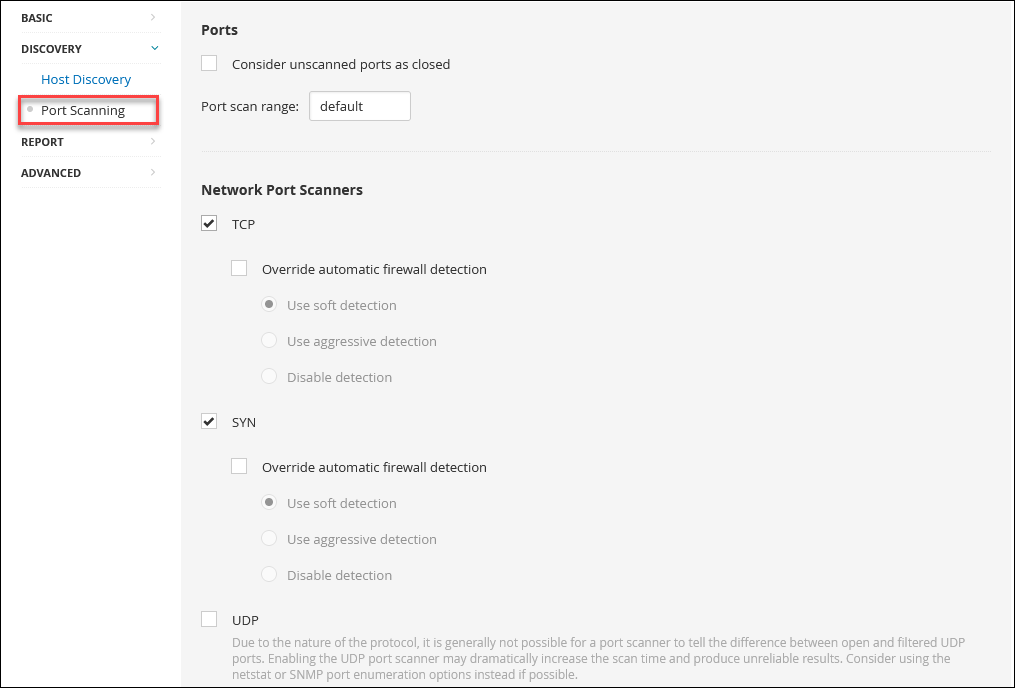
All other settings not shown in the screenshots above should remain in their default configuration. Click the Save button to save the scan settings. On the "My Scans" screen, click the Launch button to start running the discovery scan.


The scan should run in just a few minutes. When it has finished, click on the name of the scan on the "My Scans" page to view the results.

You should see results similar to those shown below, although the number of hosts discovered will vary depending on the VMs you had running during the scan.
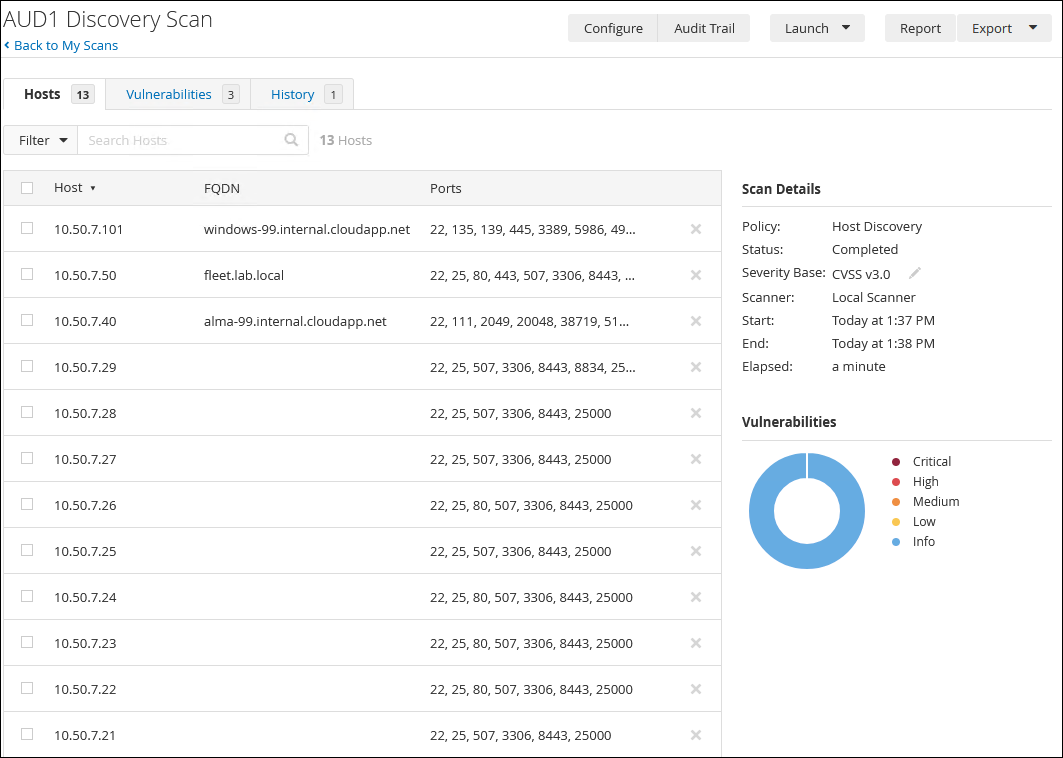
In a real audit, this list could be used in a few ways:
-
Compared against the organization's asset inventory to validate the inventory controls
-
Used as the basis for determining the scope for future audit work
-
Coupled with port scans or other Nessus built-in scans to discover issues like missing patches or misconfigurations
You may close the Firefox browser when you have completed the lab. If you have completed all the labs for today, it is okay to shut down all the VMs you have open.
Appendix: Output of Nmap Help Command
Nmap Help Output
Nmap 7.95 ( https://nmap.org )
Usage: nmap [Scan Type(s)] [Options] {target specification}
TARGET SPECIFICATION:
  Can pass hostnames, IP addresses, networks, etc.
  Ex: scanme.nmap.org, microsoft.com/24, 192.168.0.1; 10.0.0-255.1-254
  -iL <inputfilename>: Input from list of hosts/networks
  -iR <num hosts>: Choose random targets
  --exclude <host1[,host2][,host3],...>: Exclude hosts/networks
  --excludefile <exclude_file>: Exclude list from file
HOST DISCOVERY:
  -sL: List Scan - simply list targets to scan
  -sn: Ping Scan - disable port scan
  -Pn: Treat all hosts as online -- skip host discovery
  -PS/PA/PU/PY[portlist]: TCP SYN/ACK, UDP or SCTP discovery to given ports
  -PE/PP/PM: ICMP echo, timestamp, and netmask request discovery probes
  -PO[protocol list]: IP Protocol Ping
  -n/-R: Never do DNS resolution/Always resolve [default: sometimes]
  --dns-servers <serv1[,serv2],...>: Specify custom DNS servers
  --system-dns: Use OS's DNS resolver
  --traceroute: Trace hop path to each host
SCAN TECHNIQUES:
  -sS/sT/sA/sW/sM: TCP SYN/Connect()/ACK/Window/Maimon scans
  -sU: UDP Scan
  -sN/sF/sX: TCP Null, FIN, and Xmas scans
  --scanflags <flags>: Customize TCP scan flags
  -sI <zombie host[:probeport]>: Idle scan
  -sY/sZ: SCTP INIT/COOKIE-ECHO scans
  -sO: IP protocol scan
  -b <FTP relay host>: FTP bounce scan
PORT SPECIFICATION AND SCAN ORDER:
  -p <port ranges>: Only scan specified ports
    Ex: -p22; -p1-65535; -p U:53,111,137,T:21-25,80,139,8080,S:9
  --exclude-ports <port ranges>: Exclude the specified ports from scanning
  -F: Fast mode - Scan fewer ports than the default scan
  -r: Scan ports consecutively - don't randomize
  --top-ports <number>: Scan <number> most common ports
  --port-ratio <ratio>: Scan ports more common than <ratio>
SERVICE/VERSION DETECTION:
  -sV: Probe open ports to determine service/version info
  --version-intensity <level>: Set from 0 (light) to 9 (try all probes)
  --version-light: Limit to most likely probes (intensity 2)
  --version-all: Try every single probe (intensity 9)
  --version-trace: Show detailed version scan activity (for debugging)
SCRIPT SCAN:
  -sC: equivalent to --script=default
  --script=<Lua scripts>: <Lua scripts> is a comma separated list of
          directories, script-files or script-categories
  --script-args=<n1=v1,[n2=v2,...]>: provide arguments to scripts
  --script-args-file=filename: provide NSE script args in a file
  --script-trace: Show all data sent and received
  --script-updatedb: Update the script database.
  --script-help=<Lua scripts>: Show help about scripts.
          <Lua scripts> is a comma-separated list of script-files or
          script-categories.
OS DETECTION:
  -O: Enable OS detection
  --osscan-limit: Limit OS detection to promising targets
  --osscan-guess: Guess OS more aggressively
TIMING AND PERFORMANCE:
  Options which take <time> are in seconds, or append 'ms' (milliseconds),
  's' (seconds), 'm' (minutes), or 'h' (hours) to the value (e.g. 30m).
  -T<0-5>: Set timing template (higher is faster)
  --min-hostgroup/max-hostgroup <size>: Parallel host scan group sizes
  --min-parallelism/max-parallelism <numprobes>: Probe parallelization
  --min-rtt-timeout/max-rtt-timeout/initial-rtt-timeout <time>: Specifies
      probe round trip time.
  --max-retries <tries>: Caps number of port scan probe retransmissions.
  --host-timeout <time>: Give up on target after this long
  --scan-delay/--max-scan-delay <time>: Adjust delay between probes
  --min-rate <number>: Send packets no slower than <number> per second
  --max-rate <number>: Send packets no faster than <number> per second
FIREWALL/IDS EVASION AND SPOOFING:
  -f; --mtu <val>: fragment packets (optionally w/given MTU)
  -D <decoy1,decoy2[,ME],...>: Cloak a scan with decoys
  -S <IP_Address>: Spoof source address
  -e <iface>: Use specified interface
  -g/--source-port <portnum>: Use given port number
  --proxies <url1,[url2],...>: Relay connections through HTTP/SOCKS4 proxies
  --data <hex string>: Append a custom payload to sent packets
  --data-string <string>: Append a custom ASCII string to sent packets
  --data-length <num>: Append random data to sent packets
  --ip-options <options>: Send packets with specified ip options
  --ttl <val>: Set IP time-to-live field
  --spoof-mac <mac address/prefix/vendor name>: Spoof your MAC address
  --badsum: Send packets with a bogus TCP/UDP/SCTP checksum
OUTPUT:
  -oN/-oX/-oS/-oG <file>: Output scan in normal, XML, s|<rIpt kIddi3,
    and Grepable format, respectively, to the given filename.
  -oA <basename>: Output in the three major formats at once
  -v: Increase verbosity level (use -vv or more for greater effect)
  -d: Increase debugging level (use -dd or more for greater effect)
  --reason: Display the reason a port is in a particular state
  --open: Only show open (or possibly open) ports
  --packet-trace: Show all packets sent and received
  --iflist: Print host interfaces and routes (for debugging)
  --append-output: Append to rather than clobber specified output files
  --resume <filename>: Resume an aborted scan
  --noninteractive: Disable runtime interactions via keyboard
  --stylesheet <path/URL>: XSL stylesheet to transform XML output to HTML
  --webxml: Reference stylesheet from Nmap.Org for more portable XML
  --no-stylesheet: Prevent associating of XSL stylesheet w/XML output
MISC:
  -6: Enable IPv6 scanning
  -A: Enable OS detection, version detection, script scanning, and traceroute
  --datadir <dirname>: Specify custom Nmap data file location
  --send-eth/--send-ip: Send using raw ethernet frames or IP packets
  --privileged: Assume that the user is fully privileged
  --unprivileged: Assume the user lacks raw socket privileges
  -V: Print version number
  -h: Print this help summary page.
EXAMPLES:
  nmap -v -A scanme.nmap.org
  nmap -v -sn 192.168.0.0/16 10.0.0.0/8
  nmap -v -iR 10000 -Pn -p 80
SEE THE MAN PAGE (https://nmap.org/book/man.html) FOR MORE OPTIONS AND EXAMPLES